
What Does Your IQ Score Mean?
IQ Score Chart: What Does Your IQ Score Mean?
An IQ score is a standardized comparison score. It describes how your performance on a particular set of reasoning tasks compares with a relevant comparison group; it is not a percentage of correct answers and it is not a complete measure of a person’s intelligence or potential.
WorldIQTest reports scores on a standard scale with an average of 100 and a standard deviation of 15. This means a score of 100 sits at the center of the comparison distribution, while scores farther from 100 are less common. This modern approach is called a deviation IQ; it compares performance with a norm group rather than dividing “mental age” by chronological age, as defined by the APA Dictionary of Psychology.
How to read the IQ score chart
The table below provides a practical way to interpret WorldIQTest results. The percentile column shows approximately what percentage of people in the comparison sample scored at or below a result. For example, a score at the 91st percentile is at or above the scores of about 91 out of 100 people in that comparison group.
| IQ score range | Descriptive range | Approximate percentile | Approximate share of the comparison group |
|---|---|---|---|
| 130 and above | Very high | 98th percentile and above | About 2% |
| 120–129 | High | 91st–97th percentile | About 7% |
| 110–119 | Above average | 75th–90th percentile | About 16% |
| 90–109 | Average | 25th–74th percentile | About half of test-takers |
| 80–89 | Below average | 9th–24th percentile | About 16% |
| 70–79 | Low | 2nd–8th percentile | About 7% |
| 69 and below | Very low | Below the 2nd percentile | About 2% |
Important: descriptive labels vary between test publishers. “High,” “average,” and similar labels are convenient summaries, not diagnoses, fixed identities, or predictions of achievement.
Related score tables and conversions
Different tests use different scales and comparison groups. A similar-looking percentile does not mean two scores measure exactly the same ability, so score tables should be used only for the purpose stated by the test publisher.
- IQ percentile table: maps an IQ score to its percentile rank on a stated IQ scale. Use the IQ percentile calculator for a score-by-score estimate.
- ASVAB score chart: explains AFQT percentiles and military qualification categories. An AFQT percentile ranks performance against its military reference group; it is not an IQ score and should not be converted directly to IQ.
- Wonderlic-to-IQ conversion: online conversion tables are only rough, non-official estimates. Wonderlic assessments are designed for workplace cognitive assessment and can use different versions and scoring methods, so they are not interchangeable with a clinical or standardized IQ result.
- SAT score table: helps interpret a college-admissions score against SAT test-takers. SAT scores measure academic readiness and are not IQ scores.
- ACT score table: gives a composite score and national percentile for an admissions test. ACT scores can be concorded with SAT scores for admissions purposes, but neither score has a valid direct IQ conversion.
Understanding the bell curve
IQ scores are commonly displayed using a bell-shaped curve, also called a normal distribution. The center of the curve is 100. Results close to 100 are the most common; results become less common as they move farther above or below the average.
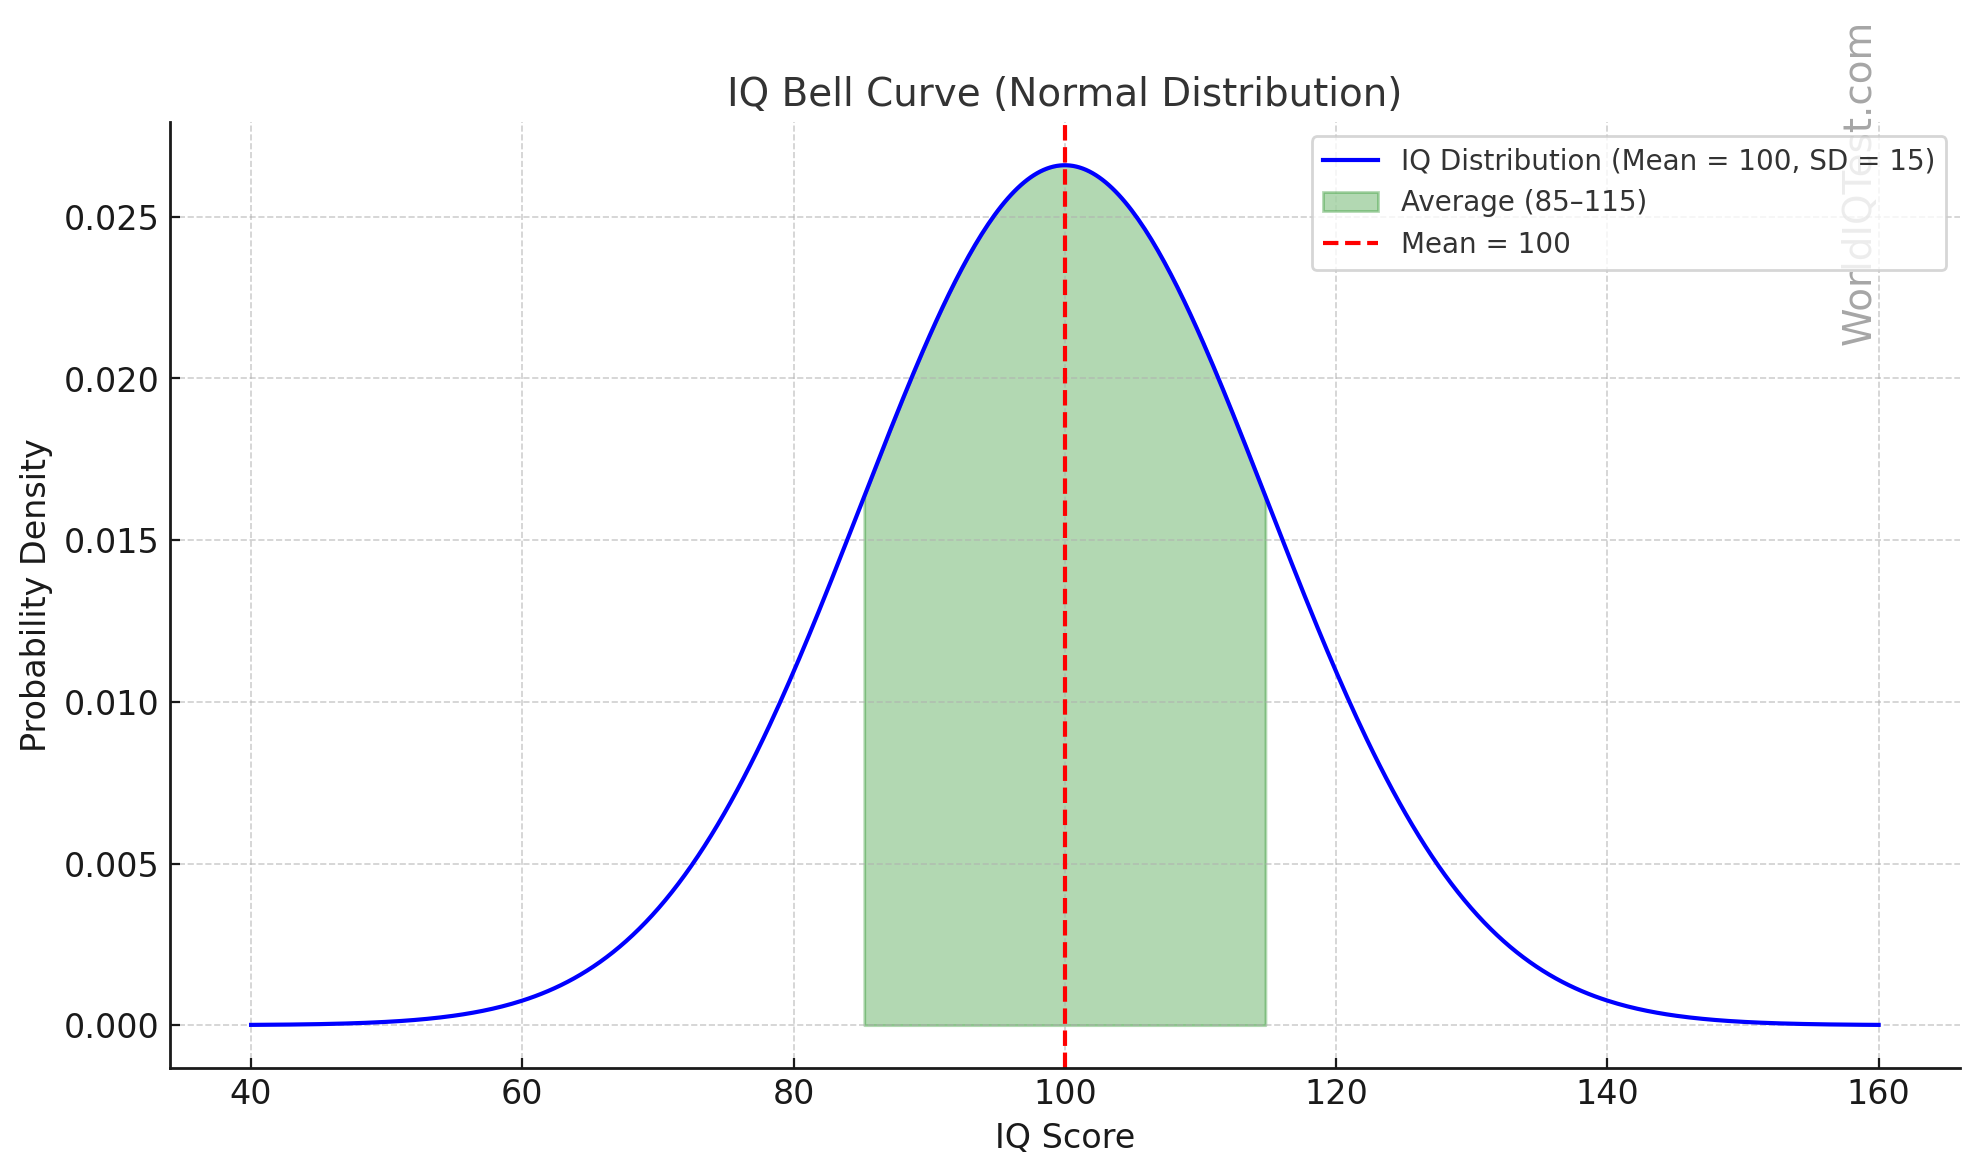
- About 68% of scores fall between 85 and 115.
- About 95% of scores fall between 70 and 130.
- A 120 score is above average and is approximately at the 91st percentile.
- A 130 score is approximately at the 98th percentile.
Percentiles add context to a score, but they do not tell you how much more capable, creative, or successful one person is than another. They only describe relative standing on this type of scale. The 68% and 95% figures above follow the usual normal-distribution model for a standard IQ scale.
What an IQ score can and cannot tell you
WorldIQTest focuses on non-verbal abstract, logical, numerical, and spatial reasoning. The score can offer a useful snapshot of how you performed on these reasoning tasks under the conditions in which you took the test.
It does not measure creativity, emotional intelligence, personality, motivation, practical judgment, wisdom, relationships, academic knowledge, character, health, opportunity, or every ability that can influence a person’s life and success.
A score should not be used to define your worth, limit your ambitions, or make assumptions about another person. Intelligence is complex, and a single online result is only one piece of information.
Why scores can vary
No test result is perfectly exact. Professional assessments commonly report confidence intervals because every observed score includes some measurement uncertainty. Online results can also be affected by sleep, stress, anxiety, distractions, device conditions, language background, familiarity with similar questions, and whether the test was completed without outside help. Professional testing standards from AERA, APA, and NCME require that a score’s intended interpretation, population, administration, and supporting validity evidence are clearly specified.
For that reason, small score differences should not be overinterpreted. A result of 100 and a result of 105, for example, do not prove a meaningful difference in a person’s overall potential or everyday capability.
IQ distribution and country comparisons
A score of 100 means average for the test’s stated norm group. It does not establish a universal global average, because tests may use different languages, samples, administration methods, dates, and national norms. Comparisons across countries need equivalent tests, representative samples, and evidence that scores mean the same thing in each setting. Research on multinational measurement likewise finds that an internationally harmonized IQ measure is not automatically available simply because tests are administered in several countries.
There is no evidence-based rule that every developing country has a flatter, narrower, or wider IQ distribution. When a test is locally normed, its reported IQ scale is usually constructed to be approximately bell-shaped around 100. What can change between populations and across time is the distribution of raw test performance before it is standardized.
For example, a peer-reviewed study by Colom, Lluis-Font, and Andrés-Pueyo (2005) of Spanish schoolchildren tested 30 years apart found that score gains were concentrated in the lower and middle parts of the distribution, with little change at the very top. The authors described this pattern as consistent with the possibility that nutrition and cognitive stimulation may affect groups differently; it is an example of a changing distribution over time, not proof that the same pattern occurs in every country.
Research also supports treating health and living conditions as relevant context, rather than assuming a national score reflects an inherent trait. A systematic review and meta-analysis by Pizzol et al. (2021) found that children with malnutrition had poorer cognitive-test performance than controls, while noting substantial study heterogeneity. A large review by Brouwers, van de Vijver, and van Hemert (2009) found that educational factors, sample educational age, and year of publication were associated with Raven’s Progressive Matrices performance across places and time, including both high- and low-income settings. See the Pizzol et al. systematic review.
For that reason, country pages should be read as descriptive information about the stated data source and time period—not as a ranking of inherent intelligence. See WorldIQTest’s average-IQ-by-country page for the site’s country data and methodology notes.
Can an online IQ score diagnose a condition?
No. WorldIQTest is an online estimate for personal insight, not a clinical assessment. It cannot diagnose intellectual disability, learning differences, ADHD, dementia, or any neurological, developmental, or psychological condition.
A clinical diagnosis of intellectual disability requires a qualified professional to consider standardized assessment results together with adaptive functioning—how a person manages conceptual, social, and practical demands in everyday life—and developmental history. An IQ number on its own is not a diagnosis, according to AAIDD diagnostic criteria.
Should you retake an IQ test?
You can retake WorldIQTest, but a later result may be influenced by practice and familiarity with the question format. Treat repeat results as additional personal information, not as proof that one score is your permanent or definitive IQ.
If you need a formal assessment for school, work, a clinical concern, or membership eligibility, speak with a qualified psychologist or the organization that requires the assessment.